CinnaEntry Start free
TEAS MathematicsReading distributions

Histograms, Box Plots & TablesATI TEAS 7 cheat sheet

Reading distributions

7 key facts Reviewed Oct 2026
The 1-minute sheetCinnaEntry

Histogram

  • Bars show frequency per interval; bars touch
  • Shows the shape of the data — skewed or symmetric

Box Plot

  • Shows minimum, Q1, median, Q3, maximum
  • The box is the middle 50% — the interquartile range

Two-Way Table

  • Rows and columns cross two categories
  • Read both headers before taking a value

Test Cue

  • Check whether the question wants a count or a percent
Key takeaway

Reading distributions

CinnaEntry website
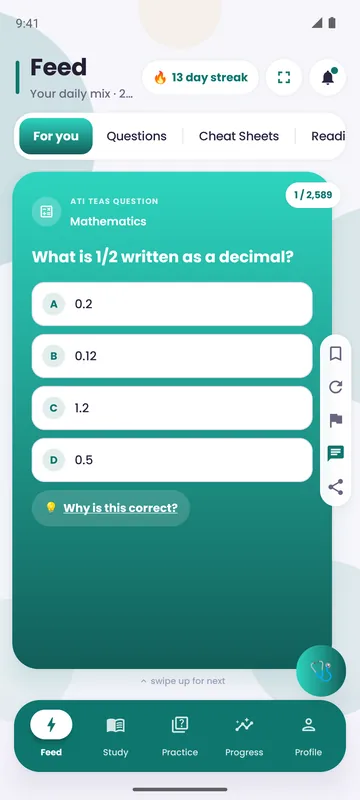
CinnaEntry app: the study feed with a practice question
Study Histograms, Box Plots & Tables in the appTEAS 7 and HESI A2 question banks with a rationale on every answer and timed practice tests.See how CinnaEntry works
Start free
Want more TEAS Mathematics questions?We'll email you a free set on Histograms, Box Plots & Tables. No account needed.

Was this helpful?

Free to start

Know histograms, box plots & tables cold

TEAS 7 and HESI A2 question banks with a rationale on every answer and timed practice tests.

  • TEAS 7 & HESI A2 question banks
  • Rationale on every answer
  • Timed full-length practice tests
  • 300+ cheat sheets
See how CinnaEntry works
CinnaEntry website
CinnaEntry app: the study feed with a practice question